Data Analyst with AI Certification
Industry Projects-Based Bootcamp Created by Hiring Managers
đ Unlock the Power of Data with Analytix Campâs Professional Data Analyst Certification Program, a comprehensive course designed to take you from a beginner to an expert in the field of data analysis. Whether youâre just starting out or looking to upgrade your skills, this Data Analyst Training program offers a complete learning path across five of the most essential tools in the industry: Excel, SQL, Power BI, Tableau, Python, Machine Learning, and AI. With a focus on real-world applications and practical skills, youâll be well-equipped to tackle the challenges of todayâs data-driven world.
100+
Case Studies
15+
Industrial Projects
01
Virtual Internship
Free
Portfolio website
01 Year
LMS Access
500+
Enrolled Learners

Created by: Muhammad Anas, Syed Ikram Ali & Muhammad Abbas
Join our Bootcamp
Learn in-demand Skills
Get Hired by Top Companies
No Questions Asked Refund Policy
Get your money within 30 days of enrollment
Why is this the Most Effective Data Analyst with AI Certification Program??
At Analytix Camp, we provide unmatched job assistance to help you succeed in your career. From crafting ATS-friendly resumes to offering a $1000 worth portfolio website and LinkedIn profile optimization, we ensure you have the tools to showcase your work and impress potential employers.
Our unlimited daily doubt clearance support through a dedicated WhatsApp community ensures you receive instant guidance, keeping your learning journey smooth and uninterrupted.
We emphasize practical job readiness by offering resume and interview preparation, interview leads, building online credibility, and mock interview sessions to boost your confidence and set you apart from the competition.
Gain hands-on experience by working on real-time industry projects across various domains, including IT, FMCG, Hospitality, CRM, Insurance, Banking, Sales, Marketing, HR, and Supply Chain. You'll work with complex datasets containing over 5 million records, mimicking real-world challenges faced in top companies.
Our highly engaging content is designed to simulate real business environments, with practice problems and realistic business meeting scenarios. Under the guidance of Industry Experts, youâll learn complex topics through simple and effective explanations.
Hear It From
Our Happy Learners
Our content is rated 4.90 from 512 Learners
The instructor explains concepts clearly with relatable analogies, making abstract ideas like normalization accessible. Their enthusiasm for SQL is contagious, and they respond promptly to questions. However, their pacing occasionally felt rushed during complex topics, and deeper technical nuances were sometimes glossed over.

Ali Abbas
Student
Sir Abbas explains SQL concepts in a very clear and practical way. The playlist is well-structured, covering basics to advanced topics with real examples. His teaching style makes learning easy and engaging. Highly recommended for anyone wanting strong SQL skills for data analytics.
Ye course students ko databases ke sath kaam karne ke liye SQL (Structured Query Language) ka practical aur theoretical knowledge deta hai. Isme aap seekhenge ke database kaise banate, manage karte aur query karte hain.
Namra Taj
Student
I really like way of teaching od sir abbas.The SQL for Data Analysis course was highly practical and well-structured. Sir Abbas explained every concept in a clear, simple, and engaging way, making complex topics easy to understand. His real-life examples, patience, and teaching style made learning enjoyable and effective. Highly recommended for beginners and professionals alike.
Dua Memon
Student
You Can
Work On Real World Projects That Hiring Managers Like

365 Super Market Inc.
This Power BI project for 365 Super Market Inc. features a comprehensive Sales and Inventory Dashboard that tracks daily sales, product performance, stock levels, and store-wise profitability. The interactive visuals provide real-time insights to help management optimize inventory management, improve sales strategies, and enhance overall operational efficiency across all supermarket locations.

365 Media Feathers
This Power BI project for 365 Media Feathers focuses on analyzing campaign performance and customer segmentation to drive more effective marketing strategies. The dashboard provides detailed insights into campaign reach, engagement, conversion rates, and ROI, while also segmenting customers based on demographics, behavior, and preferences. These real-time visuals help the marketing team optimize campaigns, target the right audiences, and maximize overall impact.

365 Granny's Cafe
This Power BI project for 365 Granny's Cafe delivers an interactive Sales and Customer Insights Dashboard that tracks daily revenue, popular menu items, customer feedback, and peak hours. The dashboard provides real-time data visualization to help management optimize menu offerings, improve customer satisfaction, and increase operational efficiency across all cafĂŠ locations.

365 Chocolate CafĂŠ
This Power BI project for 365 Chocolate CafĂŠ presents an interactive Sales and Performance Dashboard designed to help the management monitor key metrics such as daily revenue, top-selling products, branch-wise performance, and customer trends. The dashboard offers real-time insights through dynamic visuals and filters, enabling data-driven decisions to boost sales, optimize inventory, and enhance overall customer experience across all cafĂŠ locations.

365 Cosmetics Stores
This Power BI project for 365 Cosmetics Stores delivers an insightful Sales and Product Performance Dashboard that helps the management track key metrics such as daily and monthly sales, best-selling product categories, store-wise performance, and customer purchasing behavior. With interactive visuals and real-time data analysis, the dashboard supports strategic decision-making to boost sales, manage stock efficiently, and enhance customer satisfaction across all store locations.

365 Retail Inc.
This Power BI project for 365 Retail Inc. features a comprehensive Sales and Operations Dashboard designed to track key performance indicators such as revenue trends, product category performance, regional sales, and inventory status. The interactive visuals and real-time data insights enable the management to make informed decisions, streamline operations, and drive growth across all retail outlets.

365 Food Delivery
This Power BI project for 365 Food Delivery showcases a real-time Dashboard that tracks key metrics such as order volume, delivery times, customer ratings, top-selling food items, and city-wise performance. Designed to optimize operations and enhance customer satisfaction, the dashboard provides actionable insights that help the management improve delivery efficiency, monitor partner performance, and drive business growth across all service areas.

365 Hotel and Resorts
This Power BI project for 365 Hotel and Resorts presents a comprehensive Performance Dashboard that tracks key metrics such as occupancy rates, revenue per room, booking trends, guest satisfaction scores, and service performance across multiple locations. With interactive visuals and real-time insights, the dashboard empowers management to optimize operations, enhance guest experiences, and make data-driven decisions to boost profitability and overall efficiency.
Meet the ones
Teaching You

Muhammad Anas
Muhammad Anas is a skilled Business Intelligence professional with over 6 years of industry experience and a Masterâs degree in Data Science from SZABIST University. Currently leading as the Business Intelligence Consultant Lead at BluTech Consulting, he specializes in turning data into actionable insights that drive business growth.

Syed Ikram Ali
Syed Ikram Ali is a seasoned Analytics and Business Intelligence professional with over 12 years of experience across organizations such as The Citizens Foundation, Bachaa Party, RES Group, Mobilink, and Zultech (Saudi Arabia). Holding an M.Phil in Management Sciences from ILMA University and an Advanced Google Analytics certification, he combines technical expertise with strategic insight to drive impactful business decisions.

Muhammad Abbas
Muhammad Abbas is a certified Data Analyst with over 7 years of experience in Analytics and Business Intelligence. With an MBA in Finance from Iqra University and an ACCA qualification, he serves as a Business Intelligence Analyst at TechFlow Inc., USA, and runs a popular YouTube channel on Analytics and Career Growth.
Overview
What you'll learn in this Bootcamp
94 Lectures
1.1: How Learning Power BI Can Help You in Your Career?
1.2: Downloading: Power BI Desktop
1.3: Adjusting Options and Settings
1.4: Power BI Desktop Interface & Workflow
2.1: Power BI Front-End vs. Back-End
2.2: Types of Data Connectors (Files, Databases, Folders)
2.3: The Power Query Editor
2.4: Basic Table Transformations
2.5: Data QA & Profiling Tools
2.6: Text Tools
2.7: Numerical Tools
2.8: Date & Time Tools
2.9: Change Type with Locale
2.10: Conditional Columns
2.11: Calculated Column Best Practices
2.12: Grouping & Aggregating
2.13: Merging Queries
2.14: Appending Queries
2.15: Appending Files from a Folder (Connecting to Folder)
2.16: Data Source Settings
2.17: Data Source Parameters
2.18: Refreshing Queries
3.1: Database Normalization
3.2: Explaining Data Normalization (Need) in Excel
3.3: Expanded Tables
3.4: Context Transition
3.5: Evaluation Order
3.6: Fact & Dimension Tables
3.7: Primary & Foreign Keys
3.8: Relationships vs. Merged Tables
3.9: Creating Table Relationships
3.10: Managing & Editing Relationships
3.11: Star & Snowflake Schemas
3.12: Active & Inactive Relationships
3.13: Relationship Cardinality
3.14: Connecting Multiple Fact Tables
3.15: Hiding Fields from Report View
3.16: Data Formats & Categories
3.17: Creating Hierarchies
4.1: Intro to DAX Calculated Columns
4.2: Common Text Functions
4.3: Basic Date & Time Functions
4.4: Conditional & Logical Functions
4.5: The SWITCH Function
5.1: Intro to DAX Measures
5.2: Implicit vs. Explicit Measures
5.3: Dedicated Measure Tables
5.4: Understanding Filter Context and Filter Flow
5.5: Step-by-Step DAX Measure Calculation
5.6: Common DAX Function Categories
5.6: Data Visualization and Dashboard
5.7: Basic Math & Stats Functions
5.8: Counting Functions
5.9: Joining Data with RELATED
5.10: The CALCULATE Function
5.11: DAX Measure Totals
5.12: The ALL Function
5.13: The FILTER Function
5.14: Iterator (X) Functions
5.15: Time Intelligence Functions
5.16: Variables
6.1: The 3 Key Questions
6.2: Sketching the Dashboard Layout
6.3: Adding Report Pages & Objects
6.4: Cards & Multi-Row Cards
6.5: Building & Formatting Charts
6.6: Line Charts
6.7: Trend Lines & Forecasts
6.8: KPI Cards
6.9: Bar & Donut Charts
6.10: Basic Filtering Options
6.11: Table & Matrix Visuals
6.12: Conditional formatting
6.13: Top N Filtering
6.14: Top N Text Cards
6.15: Map Visuals
6.16: Report Slicers
6.17: Gauge Charts
6.18: Advanced Conditional Formatting
6.18: Area Charts
6.19: Drill Up & Drill Down
6.20: Drillthrough Filters
6.21: Editing Report Interactions
6.22: Adding Bookmarks
6.23: Custom Navigation Buttons
6.24: Slicer Panels
6.25: Numeric Range Parameters
6.26: Fields Parameters
6.27: Custom Tool Tips
7.1: Anomaly Detection
7.2: Smart Narratives
7.3: Q&A Visuals
7.4: Decomposition Trees
7.5: Key Influencers
86 Lectures
1.1: Course Outline
1.2: Discuss the Career Paths
1.3: What is a Database and it's need?
1.4: Why learning SQL?
1.5: Explaining DataLake, DataWarehouse and DataMart.
1.6: SQL Server vs MySQL vs PostgreSQL
2.1: Installation and Introduction to Azure Data Studio
2.2: Creating a Connection to a Database
2.3: Company Profile: Adventure Works?
2.4: SELECT and FROM
2.5: SELECT Specific Columns
2.6: Creating a Column Alias
2.7: Using WHERE Statement to Filter Rows
2.8: Checking the Impact of a WHERE Filter
2.9: Using GROUP BY Statement to Combine Rows
2.10: Limiting Results to 1 Row for Testing
2.11: Using GROUP BY to Combine Rows
2.12: Using HAVING Statement to Filter Grouped Rows
2.13: Filtering Grouped Rows with HAVING
2.14: SQL Order of Operations
2.15: Using ORDER BY Statement to Sort Query Rows
2.16: Filtering Rows using TOP N
2.17: Filtering Rows using TOP N Percent
2.18: Filtering Rows using OFFSET FETCH
2.19: Filtering Rows DISTINCT Values
3.1: Counting Rows with COUNT( ) Aggregation
3.2: How Aggregate Functions Respond to NULL Values
3.3: The Importance of Data Types
3.4: Numeric Data Types
3.5: Numeric Functions
3.6: Where is the Boolean Data Type
3.7: Date and Time Data Types
3.8: Date Parts
3.9: Date and Time Functions
3.10: The DATEADD Function
3.11: Working with Specific Dates
3.12: Text or String Data Types
3.13: String Functions
3.14: Comparison Operators
3.15: Comparison Operators - Dealing with NULL
3.16: Logical Operators
3.17: Logical Operators - Common Errors
3.18: Advanced Logical Operators - IN and BETWEEN
3.19: Advanced Logical Operators - LIKE
3.20: Using IIF Statements to Create a Conditional Column
3.21: Using a CASE Statement for Multiple Conditions
3.22: Basic SQL Formatting
3.23: Using IIF in a WHERE Statement
3.24: Replacing NULL Using IIF and ISNULL
3.25: Using CAST to Change the Data Type
4.1: Fact and Dimension Tables
4.2: Relationships & Keys
4.3: The Star Schema
4.4: Snowflake Hybrid Schema
5.1: Relationships and ER Diagrams
5.2: Purpose of DW Relationships
5.3: Internet Sales Schema
5.4: Types of JOIN
5.5: A Basic INNER JOIN Using Sales and Customers
5.6: Returning Only the TOP 100 Customers
5.7: INNER JOIN the Another Table
5.8: HAVING or WHERE
5.9: When INNER JOIN Doesn't Work
5.10: Is INNER and LEFT Join are same in Industries?
5.11: RIGHT JOIN Application
5.12: LEFT JOIN vs RIGHT JOIN
5.13: Self Joins
5.14: Cross Joins
5.15: Natural Join
5.16: Appending Data with a UNION
5.17: Exploring the Reseller Schema
5.18: Creating a UNION between Fact Tables
5.19: Identifying the Source of Each UNION Row
5.20: Using ORDER BY with a UNION
5.21: Creating a View
5.22: Querying a View
5.23: Creating Dynamic Results Using Subqueries
5.24: Explain Scalar, Multi Rows and Correlation Sub Queries
5.25: Examples: Sub Queries
6.1: Window Functions Introduction
6.2: Window Functions Basics - Over + Partition By
6.3: Row Number
6.4: Customers Largest Purchases
6.5: Rank and Dense Rank
6.6: Art Ranking
6.7: Lag and Lead
80 Lectures
1.1: Introduction of MS Excel
1.2: Text Functions
1.2: Data Visualization
1.3: Aggregation Functions
1.4: Conditional Functions
1.5: Lookup Functions
1.6: Data Cleaning
2.1: Columns, Bar, Line Charts
2.2: Pie, Donut and Histogram Chart
2.3: Waterfall Chart
2.4: Combo Charts
2.5: Advanced Charting Techniques
3.1: Data Tables
3.2: Goal Seek
3.3: Scenario Manager
3.4: Solver
5.1: Why Pivot Tables?
5.2: Structuring Source Data for Analysis in Excel
5.3: Creating Your First Pivot Table
5.4: Navigating the Pivot Table Field List
5.5: Exploring Pivot Table Analyze & Design Options
5.6: Selecting, Clearing, Moving & Copying Pivot Tables
5.7: Refreshing & Updating Pivot Tables
5.8: Dealing with Growing Source Data
5.9: How Excel Pivot Tables ACTUALLY Work
7.1: Sorting Data with Pivot Tables
7.2: Fixing Incorrect Alphabetical Sorting
7.3: Filtering Data with Pivot Table Label & Selection Filters
7.4: Pivot Table Label Filters with Wildcards
7.5: Filtering Data with Pivot Table Value Filters
7.6: Enabling Multiple Pivot Table Filters
7.7: Grouping & Segmenting Data with Pivot Tables
7.8: Enabling & Disabling Automatic Date Grouping
7.9: Filtering Data with Pivot Table Slicers & Timelines
7.10: Breaking Out Pivot Table Report Filter Pages
8.1: Aggregating & Summarizing Data with Pivot Tables
8.2: Defining Value Calculations with Pivot Tables
8.3: Calculating Pivot Table Values: % of Column/Row
8.4: Calculating Pivot Table Values: % of Parent
8.5: Calculating Pivot Table Values: Difference From
8.6: Calculating Pivot Table Values: Running Total
8.7: Calculating Pivot Table Values: Rank
8.8: Defining Calculated Fields with Pivot Tables
8.9: Creating Calculated Fields in Pivot Tables vs. Source Data
8.10: Pivot Table Calculations Using Count Columns
10.1: Introduction of Power Query in Excel
10.2: Connecting to the Database
10.3: Cleaning Data In Power Query
10.4: Merging Data in Power Query
10.5: Adding New Columns in Power Query
10.6: Loading Power Query Data to Excel
11.1: Pivot Table For Movie Analytics
11.2: Creating a Report Using Pivot Table
11.3: Using Power Pivot & DAX For Powerful Business Reports
11.4: Adding Targets Using Data Modelling in Power Pivot
11.5: Breaking Down Complex Problems: Thinking Process of a Highly Paid Data Analyst
11.6: More Business Metrics and Conditional Formatting
11.7: VBA Basics & How Much VBA You Should Learn
12.1: 365 Hardwareâs Business Model
12.2: Usage of Excel & Business Requirement in 365 Hardware
12.3: ETL (Extract, Transform and Load Data) in Excel
12.4: Business Report: Solution Design Thought Process
12.5: Creating Connections Among Tables Using Data Modelling
12.6: Adding a Date Table Using Power Query
12.7: Functional Knowledge: Sales
12.8: Sales Analytics: Creating Customer Performance Report
12.9: User Empathetic Report Design
12.10: Sales Analytics: Creating Market Performance vs Targets Reported
12.11: Understanding P & L
12.12: Functional Knowledge: Finance
12.13: Adding the Finance Data to Data Model
12.14: Finance Analytics: P & L by Year Report
12.15: Fine Tuning P & L By Year Report
12.16: Adding Months & Quarters in Data Model
12.17: Finance Analytics: P & L by Months Report
12.18: Fine Tuning P & L By Month Report
12.19: Wandaâs Challenge With Prioritizing Projects
12.20: Peter & Tony Creates a Project Priority Matrix
12.21: Bruce Haryali Needs Help With Excel
12.22: Peter & Tony Creates a Scenario Planning Tool
85 Lectures
1.1: Course Overview
1.2: Python Overview
1.3: Anaconda Distribution Installation
1.4: Jupyter Notebook 101
1.5: Jupyter Notebook â Adding Comments in Cells
1.6: Course Resources â Important!
2.1: Objects and Variables Overview
2.2: Numbers
2.3: Strings
2.4: String Operations
2.5: String Methods and Properties
2.6: String Concatenation and Formatting
2.7: Lists
2.8: Dictionaries
2.9: Tuples and Sets
2.10: Booleans
3.1: Python Operators
3.2: Control Flow
3.3: For Loops
3.4: For Loops (continued)
3.5: While Loops
3.6: Break, Continue and Pass Statements
3.7: List Comprehension
3.8: IN and NOT IN
4.1: Built-In Functions
4.2: User Defined Functions
4.3: User Defined Functions â Examples
4.4: Arguments and Keyword Arguments
4.5: Map and Filter
4.6: Lambda Functions
4.7: Errors and Exception Handling
5.1: Challenge Questions Overview
5.2: Solutions Walkthrough
6.1: Built-In Modules
6.2: External Libraries
7.1: NumPy Overview
7.2: Array Slicing and Indexing
7.3: Array Manipulation Functions
7.4: Additional Array Creation Functions
7.5: Array Arithmetic and Mathematical Functions
7.6: IO Functions in NumPy
8.1: Challenge Questions
8.2: Challenge Solutions
9.1: Pandas Overview
9.2: Introduction to Series
9.3: Introduction to DataFrames
9.4: Selecting Data
9.5: Selecting Data 2
9.6: Data Manipulation 1
9.7: Data Manipulation 2
9.8: Data Aggregation and Grouping
9.9: Data Cleansing
9.10: Combining DataFrames
9.11: Windowing Operations
10.1: Challenge Questions â TFL Dataset
10.2: Solutions Walkthrough
10.3: Challenge Questions â Employees Dataset
10.4: Solutions Walkthrough
11.1: Excel and CSV
11.2: HTML
11.3: Databases
11.4: Pandas Input and Output Methods
12.1: Matplotlib Overview
12.2: Choosing the Right Chart Type
12.3: Creating a Plot Area 1
12.4: Creating a Plot Area 2
12.5: Bar Plots
12.6: Line Plots
12.7: Scatter Plots
12.8: Histograms
12.9: Box Plots and Violin Plots
12.10: Style and Presentation
12.11: Additional Resources and Cheat Sheets
13.1: Challenge Questions Overview
13.2: Solutions Walkthrough
14.1: Seaborn Overview
14.2: Categorical Plots
14.3: Relational Plots
14.4: Distribution Plots
14.5: Regression Plots
14.6: Matrix Plots
14.7: Multi Plot Grids
14.8: Style and Presentation
15.1: Challenge Questions Overview
15.2: Solutions Walkthrough
38 Lectures
1.1: What is Tableau?
1.2: Installing Tableau
1.3: Tableau UI Walkthrough
2.1: Creating a Bar Chart
2.2: Tableau Colors
2.3: Filters and Formatting
3.1: Time Series Aggregations
3.2: Categorical Aggregations
3.3: Calculated Fields
3.4: Table Calculations
3.5: Groups
3.6: Bins and Parameters
4.1: Creating our Visualizations
4.2: Building the Dashboard
4.3: Formatting our Dashboard
4.4: Adding Filters
4.5: Adding Highlighting
4.6: Sharing our Dashboard
5.1: What are Joins?
5.2: Connecting Multiple Datasets
5.3: Unions
5.4: Joining on Real Data
6.1: Creating Hierarchies
6.2: Building Geographical Maps
6.3: Creating Visualizations for Stories
6.4: Creating our Story (Mini Project)
7.1: Histograms
7.2: Box and Whisker Plots
7.3: Area Charts
7.4: Dual Combination Chart
7.5: Gannt Chart
7.6: TreeMaps and Packed Bubble Charts
8.1: Data Interpreter â Part 1
8.2: Data Interpreter â Part 2 + Pivoting Data
8.3: Splitting and Combining Columns
8.4: Analytics Tab
8.5: Clusters
8.6: Forecasting
13 Lectures
1.1: Overview: What This Module Will Deliver
2.1: The Rationale Behind Fabric: Tackling the 365 Enterprises Challenge
2.2: Exploring Fabric Through Your Power BI Interface
2.3: Unpacking Fabricâs Architecture
2.4: Essential Knowledge for Aspiring Data Analysts
2.5: Options for Data Storage
2.6: Approaches to Data Transformation
3.1: Defining the Challenge: 365 Enterprisesâ Pilot Project on Fabric
3.2: Mapping Out the Project Roadmap
4.1: Integrating External Data Sources in Fabric
4.2: Transitioning Legacy BI 360 BI to Fabric
4.3: Updating and Publishing BI 360 Content on Fabric
4.4: Coordinating Data Refreshes with Pipeline Automation
33 Lectures
1.1: Advancements in AI for Data Analysts
2.1: The Fundamentals of Machine Learning
2.2: Classification vs. Regression Explained
2.3: Supervised vs. Unsupervised Learning Demystified
2.4: Overview of Key ML Algorithms
2.5: Essential Tools for Machine Learning
3.1: The 10 Stages of an AI Project
3.2: Defining Requirements and Scope of Work (SOW)
3.3: Data Collection Best Practices
3.4: Data Preparation & Exploratory Analysis
3.5: Feature Engineering Techniques
3.6: Choosing & Training the Right Model
3.7: Evaluating Models: Accuracy, Precision, Recall & F1 Score
3.8: Selecting the Right Evaluation Metric for Your Use Case
3.9: Fine-Tuning Models for Better Performance
3.10: Deploying AI Models in Production
3.11: Managing AI Deployments with ML Ops
4.1: The Critical Role of Data in AI Success
4.2: Understanding a Companyâs Data Infrastructure
4.3: Data Collection Strategies
4.4: Data Storage & Transformation Essentials
4.5: Data Privacy, Ethics, and Governance in AI
5.1: Automating Data Collection
5.2: Enhancing Data Cleaning with AI
5.3: Streamlining Data Transformation
5.4: Extracting Insights & Visualizing Data with AI
6.1: Why Human Communication Skills Still Matter More Than AI
6.2: Leveraging AI for Emails & Presentations
7.1: Optimizing Job Titles & Customizing Resumes with AI
7.2: Using AI to Request Referrals Effectively
7.3: AI-Powered Mock Interviews: Resume & Role-Specific Questions
7.4: AI-Powered Mock Interviews: Technical Rounds
7.5: AI-Powered Mock Interviews: Case Studies & Behavioral Assessments
Data Analyst with AI Certification
Market Opportunity
In todayâs competitive job market, having the right skills is essential but not enough. To truly launch or accelerate your career in Data Analytics and AI, you need expert guidance, practical training, and the ability to showcase your skills effectively. At 365 Boot Camp, we support you every step of the way from building job-ready skills with quality teaching to helping you present your expertise confidently and stand out in the crowd.
We help you in each and every step to achieve that:
$1000 Worth Portfolio Website
Create an ATS Resume
LinkedIn Optimization
Building Online Credibility
Virtual Internship

26,50,000 PKR
Average Yearly Salary of Data Analyst
Based on Data from Economic Research Institute (ERI)
100+ Job Openings
No. of Job Openings each Week
Based on Data from Linkedin.Com
2nd Position
Most In-Demand Skill till 2033
Based on Data from Forbes.Com
$30 Per Hour
Average Per Hour Rate
Based on Data from Upwork.Com
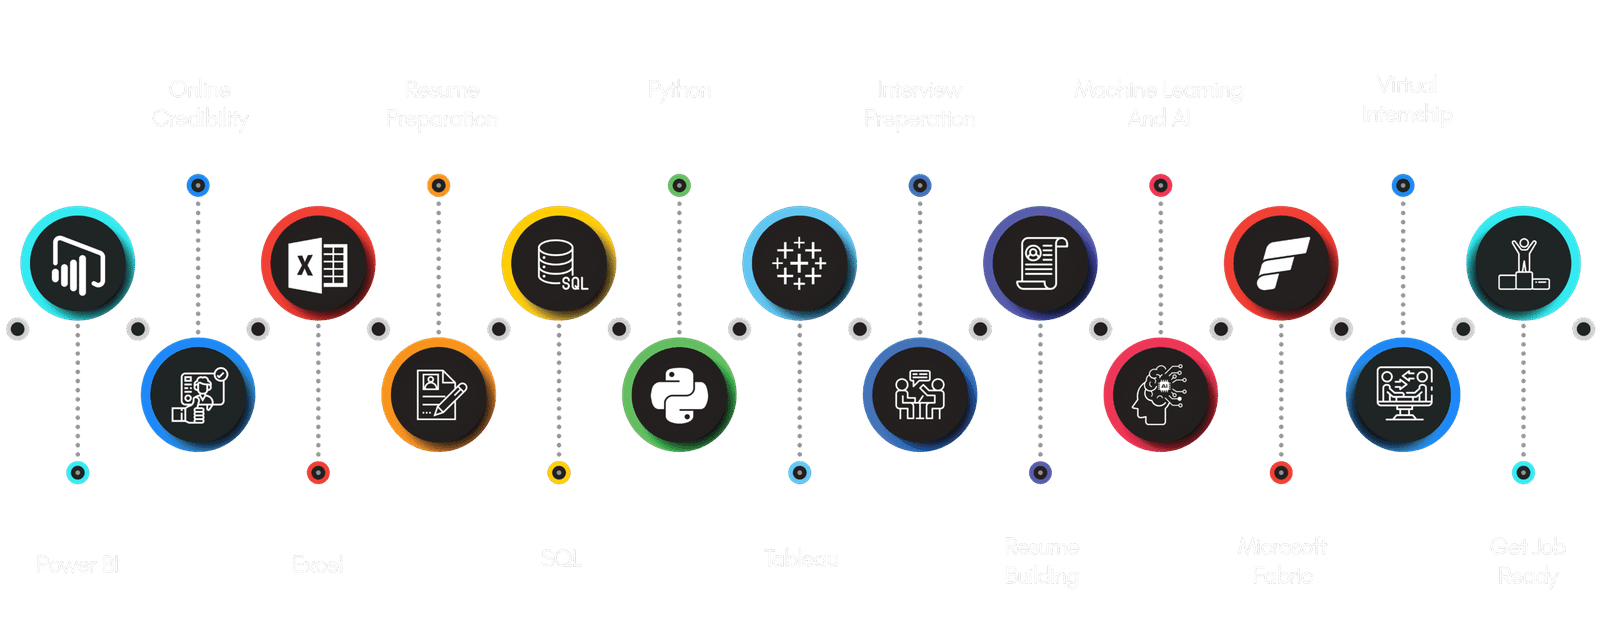
Career
Bootcamp Journey

May we help you?
Frequently Asked Questions

Yes, all classes are conducted live via Zoom. This ensures interactive learning and allows you to directly engage with instructors and fellow students.
Yes, we provide a virtual internship as part of the course. This hands-on experience helps you apply the skills youâve learned to real-world projects.